Learn Technical Analysis (Simplified for Beginners (not Dummies))
Technical analysis is the study of price movements using charts. Unlike fundamental analysis, which looks at company earnings and financials, technical analysis focuses on patterns and trends to predict future price movements.
Why is Technical Analysis Important?
✅ Helps identify the best times to buy and sell stocks.
✅ Allows traders to spot trends and avoid bad trades.
✅ Works for short-term and long-term trading.
A. Understanding Candlestick Charts (Your Trading Roadmap)
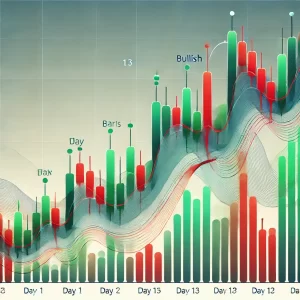
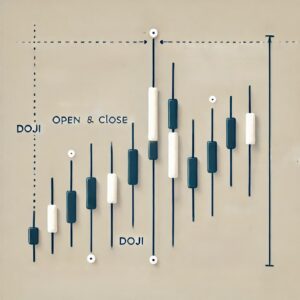
Candlestick charts are the most popular way to visualize price movements. Each "candle" represents a specific time period (e.g., 1 minute, 1 hour, 1 day) and shows:
- Opening Price – Where the stock started.
- Closing Price – Where the stock ended.
- High & Low Prices – The highest and lowest prices reached.
👉 Green Candles (Bullish) – The stock closed higher than it opened.
👉 Red Candles (Bearish) – The stock closed lower than it opened.

🔹 Beginner Tip: Focus on daily charts (1-day candles) to start. Shorter timeframes (1-minute, 5-minute charts) are for advanced traders.
B. Key Candlestick Patterns Every Beginner Should Know
1️⃣ Doji – Market indecision; price may reverse soon.

2️⃣ Hammer – Bullish reversal; the stock may go up.

3️⃣ Shooting Star – Bearish reversal; the stock may drop.

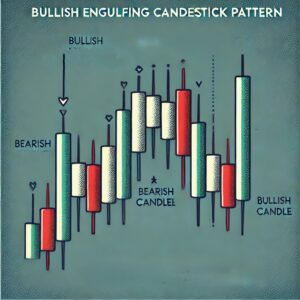
4️⃣ Engulfing Pattern – A strong signal that a trend is changing.

🔹 Beginner Tip: Stick to simple patterns like the hammer and engulfing pattern to spot strong trade signals.
C. Support & Resistance (Where Prices Bounce or Break)
- Support = A price level where stocks tend to stop falling and bounce back up.
- Resistance = A price level where stocks tend to stop rising and drop back down.
🔹 Beginner Tip: Look for stocks that break through resistance with high volume (more buyers). This is often a good buying opportunity.
D. Simple Indicators to Predict Price Movements
Indicators help confirm trends and trading signals. Here are two beginner-friendly indicators:
1️⃣ Moving Averages (Trend Tracker)
- Smooths out price movements to show the overall trend.
- 50-Day & 200-Day Moving Averages – Stocks above these lines are in an uptrend; stocks below are in a downtrend.
2️⃣ Relative Strength Index (RSI) (Overbought/Oversold Indicator)
- Measures whether a stock is overbought (70+) or oversold (30-).
- RSI below 30 = Stock might be too cheap and ready to rise.
- RSI above 70 = Stock might be too expensive and ready to drop.
🔹 Beginner Tip: Use the 50-day moving average to confirm trends and RSI to check if a stock is overbought or oversold before buying.
E. Putting It All Together (Simple Beginner Strategy)
✅ Step 1: Look for a stock trading above the 50-day moving average (Uptrend).
✅ Step 2: Check RSI – If it's near 30, the stock may be oversold (good buy opportunity).
✅ Step 3: Look for a bullish candlestick pattern (like a Hammer) near a support level.
✅ Step 4: Enter the trade and set a stop-loss below support to protect against losses.
🔹 Beginner Tip: Use free charting tools like TradingView or your broker’s platform to practice.
Final Thoughts on Technical Analysis for Beginners
📌 Start Simple – Focus on a few key indicators instead of learning everything at once.
📌 Practice with Paper Trading – Use demo accounts to test strategies before risking real money.
📌 Be Patient – Profitable trading comes from consistency, not guessing.
By following this structured approach, beginners can quickly develop confidence in reading charts and making better trading decisions.
How Technical Analysis fits in the whole endeavor of stock trading.

