The Value of RSI in the Stock Market: A Powerful Indicator for Investors

The Value of RSI in the Stock Market: A Powerful Indicator for Investors

In the fast-paced world of the stock market, investors constantly search for tools and indicators that can help them make informed decisions. One such tool is the Relative Strength Index (RSI), a popular and valuable technical indicator. The RSI provides insights into a stock's price momentum and helps investors identify potential buy or sell signals. In this article, we will explore the value of RSI in the stock market and how investors can leverage its power.

Understanding RSI

The Relative Strength Index (RSI) is a momentum oscillator that measures the speed and change of price movements. It compares the magnitude of recent gains and losses over a specified period, typically 14 trading days, and displays the results on a scale of 0 to 100. RSI values above 70 indicate overbought conditions, suggesting a potential price reversal or correction, while values below 30 indicate oversold conditions, indicating a possible upward price movement.

Key Benefits

Identifying Overbought and Oversold Levels: RSI helps investors identify extreme price conditions. When the RSI reaches or exceeds the 70 level, it suggests that the stock may be overbought and due for a downward correction. Conversely, an RSI value below 30 suggests that the stock may be oversold and could experience a rebound in the near future. These overbought and oversold levels can assist in timing entry or exit points.

Confirmation of Price Trends: RSI can confirm the strength and sustainability of a price trend. When the RSI moves in the same direction as the stock price, it confirms the prevailing trend. If a stock is in an uptrend and the RSI is consistently making higher highs, it indicates strong bullish momentum. Conversely, if a stock is in a downtrend and the RSI is consistently making lower lows, it confirms bearish momentum.

Divergence Patterns: RSI can help identify potential trend reversals through divergence patterns. Bullish divergence occurs when the stock price makes a lower low while the RSI forms a higher low, indicating weakening selling pressure and a possible upward reversal. Conversely, bearish divergence occurs when the stock price makes a higher high while the RSI forms a lower high, suggesting waning buying pressure and a potential downward reversal. These patterns can provide early indications of a trend change.

Confirmation with Support and Resistance Levels: RSI can be used in conjunction with support and resistance levels to validate potential breakout or breakdown scenarios. When a stock breaks above a resistance level with the RSI in overbought territory, it suggests a strong bullish signal. Similarly, if a stock breaks below a support level with the RSI in oversold territory, it strengthens the bearish signal.

Strategies for Using RSI

RSI Divergence Trading: Look for bullish or bearish divergence patterns on the RSI chart to anticipate trend reversals. Combine this information with other technical indicators and confirmatory signals for stronger trade decisions.

Overbought and Oversold Levels: Utilize RSI levels above 70 as potential sell signals and levels below 30 as potential buy signals. However, it's important to note that stocks can remain overbought or oversold for extended periods, so it's advisable to use RSI in conjunction with other indicators for confirmation.

RSI and Trend Confirmation: Use RSI to confirm the strength of an existing trend. When the RSI aligns with the prevailing price trend, it provides additional confidence in the direction of the market.

Combine RSI with Support and Resistance: Combine RSI analysis with key support and resistance levels to validate potential breakout or breakdown scenarios. This approach helps confirm the validity of technical patterns and enhances decision-making.

The Relative Strength Index (RSI) is a powerful and versatile technical indicator that can assist investors in making informed decisions in the stock market. By providing insights into overbought and oversold levels, confirming price trends, and identifying divergence patterns, the RSI adds value to investors' analysis. However, like any tool, it should be used in conjunction with other indicators and thorough research to make well-rounded investment choices. With proper understanding and implementation, the RSI can be an invaluable asset in an investor's toolkit.

How Accumulation and Distribution Affect Stock Prices

Since stock market prices fluctuate on phases of supply and demand investors can trade securities to capitalize on these market price movements. Informed investment decisions based on precise price movements depend on understanding the concepts of accumulation and distribution. These phases of market behavior can help investors identify potential trends and make strategic moves to make a profit. In this article, we will identify what accumulation and distribution, explore their significance, and suggest strategies for using them to individual investor advantage.

Identifying Accumulation

Accumulation refers to a phase in the market cycle when institutional investors, such as mutual funds, pension funds, and hedge funds, begin accumulating stocks or other securities. During this phase, informed market participants believe that the prices of certain stocks are undervalued or have the potential for future growth.

Accumulation can occur after a prolonged downtrend, when investors see an opportunity for a potential reversal. Institutions and savvy investors accumulate stocks during this phase, gradually increasing their holdings. Their actions create demand, leading to a steady rise in prices.

Key Indicators of Accumulation

Volume - Increasing trading volume is often a strong indicator of accumulation. Higher volume suggests increased market participation, signaling institutional buying.

Price Stability - During accumulation, prices tend to stabilize or form a base, indicating that buyers are supporting the stock at a certain level. This consolidation phase often precedes a potential upward move.

Positive News Flow - Accumulation is often accompanied by positive news or events that suggest the stock's potential growth. These catalysts can attract institutional interest and encourage buying activity.

Strategies for Accumulation

Identify Fundamental Value - Conduct thorough fundamental analysis to identify undervalued stocks with strong growth potential. Look for companies with solid financials, a competitive advantage, and a positive outlook for the industry.

Technical Analysis - Utilize technical indicators and chart patterns to identify accumulation phases. Look for consolidating price patterns, increasing volume, and signs of buying pressure.

Patience and Gradual Buying - Accumulation is a patient strategy. Gradually build your position over time, taking advantage of price dips and consolidation periods. This approach minimizes the impact of short-term market fluctuations.

Identifying Distribution

Distribution is the opposite of accumulation and occurs when institutional investors begin to sell their holdings. It typically happens after a prolonged uptrend, when investors believe that a stock is overvalued or when they anticipate a market decline.

During distribution, institutions and informed investors gradually sell their positions, creating selling pressure and reducing demand. This can lead to a decline in stock prices.

Key Indicators of Distribution

Volume - Increasing trading volume during a downtrend suggests distribution. Higher volume indicates a surge in selling pressure and signals that institutions are offloading their holdings.

Price Weakness - Stocks experiencing distribution tend to exhibit weak price action, with lower highs and lower lows. This indicates a loss of buying interest and the potential for a downward trend.

Negative News Flow - Negative news, disappointing earnings reports, or adverse events can trigger distribution. Institutions may use such catalysts as opportunities to sell their positions.

Strategies for Distribution

Set Price Targets - Establish realistic price targets for your investments based on fundamental and technical analysis. Consider selling when the stock reaches your target or shows signs of weakness.

Trailing Stops - Utilize trailing stop orders to protect profits during distribution phases. These orders automatically adjust the sell price based on the stock's performance, allowing you to capture gains while limiting potential losses.

Diversify Your Portfolio: Spread your investments across different sectors and asset classes. Diversification helps mitigate the impact of a single stock's distribution on your overall portfolio performance.

Bottom Line

Accumulation and distribution are integral phases of the stock market cycle that can provide valuable insights into the actions of big smart money stock investors and potentially help individual traders move in conjunction with the smart money that is moving the market. Quick identification of stocks being accumulated or distributed is key to maximizing profits. Most Excellent investor members have access to watchlists made up of stocks in both phases aggregated so that quick decision making can occur for buying or selling.  Sign up now.

Understanding Stock Market Accumulation and Distribution

The stock market is a dynamic ecosystem where prices fluctuate based on the forces of supply and demand. To navigate this complex landscape, investors employ various strategies to maximize their returns. Two crucial concepts in stock market analysis are accumulation and distribution. These terms describe the actions of institutional investors and provide valuable insights for individual traders. In this article, we will delve into the meaning of accumulation and distribution, explore the indicators used to identify these phases, and discuss strategies investors can adopt to capitalize on them.

What is Accumulation?

Accumulation refers to the phase in which large institutional investors, such as mutual funds, hedge funds, and pension funds, are actively buying shares of a particular stock or asset. During this phase, the demand for the stock exceeds the supply, leading to an upward price trend. Accumulation often occurs after a period of decline or consolidation when smart money investors perceive the stock to be undervalued.

Identifying Accumulation

Several indicators can help identify the accumulation phase. One common indicator is the volume, which measures the number of shares traded in a given period. In an accumulation phase, trading volume tends to increase, reflecting the higher activity of institutional investors entering the market. Additionally, technical analysis tools like the on-balance volume (OBV) indicator can help detect accumulation. The OBV measures the cumulative volume flow in a stock, and when it rises, it suggests increased buying pressure, signaling accumulation.

Strategies for Accumulation

For individual investors, identifying accumulation can present an opportunity to align their positions with institutional investors and potentially benefit from the price appreciation. Some strategies to consider during the accumulation phase include:

Trend Confirmation: Confirming the stock's upward trend through technical analysis can help investors validate the accumulation phase. Tools like moving averages or trend lines can provide insights into the stock's overall direction.

Breakout Trading: Once the accumulation phase is confirmed, investors may look for breakouts, which occur when the stock's price surpasses a resistance level. Breakouts can signal a potential continuation of the upward trend and provide entry points for traders.

What is Distribution?

Distribution is the opposite of accumulation and occurs when institutional investors start selling their shares. This phase typically follows a prolonged uptrend in the stock's price, as institutions capitalize on their gains. As the supply of shares exceeds demand, the stock's price may start to decline.

Identifying Distribution

Similar to accumulation, identifying the distribution phase relies on various indicators. Increased trading volume, particularly when accompanied by declining prices, can indicate that institutional investors are offloading their positions. Technical analysis tools like the relative strength index (RSI) can also help identify overbought conditions, suggesting a potential distribution phase.

Strategies for Distribution

Investors should exercise caution during the distribution phase, as the stock's price is likely to decline. Strategies to consider during this phase include:

Trend Reversal Confirmation: Confirming the stock's reversal through technical analysis can help investors avoid further losses. Tools like trend lines, moving averages, or chart patterns can help identify potential trend reversals.

Short Selling: Sophisticated traders may consider short selling during the distribution phase. Short selling involves borrowing shares from a broker and selling them with the expectation of buying them back at a lower price in the future. This strategy allows traders to profit from a declining stock price.

Conclusion

Understanding stock market accumulation and distribution is essential for investors looking to make informed decisions. Identifying these phases can provide valuable insights into the actions of institutional investors and potentially help individual traders align their positions with smart money. By utilizing technical analysis tools and following appropriate strategies, investors can increase their chances of capitalizing on the opportunities presented during the accumulation and distribution phases.

Make Stock Market Volatility Work for You

How To Make Stock Market Volatility Work for You?

Stock day traders actually want stock market prices to make big moves. A stagnant market where prices don't move or move in very small increments means that money invested in such a market is "dead money".

When stock prices are volatile even a stock with a price that ends down from the prior day can make winning moves during the current trading day (intraday) before ending down at the end of the day. An investor buying a stock close to its intraday low and then selling it after the price rises intraday can make a profit. The trick is finding stocks with such a trade set up.

What are the characteristics of a profitable intraday stock?

Volatility over multiple days backed by sufficient volume that shows there is trader interest in the stock. The volatility has to be over multiple trading days with moderate to big price movement taking place during each trading day. The research to find such stocks is already done for you on the watchlists in the Most Excellent Investor membership area.

The psychology needed to trade a volatile market?

Even after finding volatile stocks that meet the criteria for volume a trader needs to have the "guts" to buy into a stock position and hold that position long enough for the price to rise during the trading day. Because after buying a stock at what can be considered a comparatively low price that price can drift even lower before rising above the purchase price. Check out the case study of the stock below from March 23, 2022.

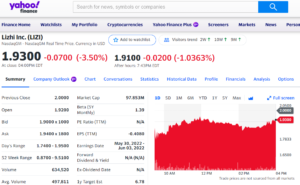
Case study profitable intraday winning stock: Lizhi Inc. (LIZI)

Make stock market volatility work for you
Intraday winning chart for end of day losing stock

Buying stock symbol LIZI at 9:34 AM on March 23, 2922 for $1.78 would earn a profit of between 1.8% - 9.5% if sold anytime between 9:38 AM and 11:56 AM. A profit of between 3.5% and 8.4% could be made if the position was closed (sold) anytime after 11:56 AM.

Every day there are dozens, if not hundreds, of stocks that trade with sufficient volatility like the case study shown above. With proper stock research and trader mentality a volatile market will make opportunity for big profits!

Combat Stock Trading Company Limitations That Anger Investors

What happens when an investor sets up a profitable trading strategy but the trading company platform (think Robinhood) limits functionality (trading options) for the particular stock being traded? A potentially profitable trading strategy can lose money because volume is an important part of the trade set up and if purchasing of shares is being limited by the trading platform then entering and exiting a trade is hindered before a profit can be taken. As the saying goes, you make money when you buy so the decision to buy and the amount of shares to buy is key.

Recently when the idea of trading shares of GameStop  (GME) went viral it caused so much volatility that some trading platforms like Robinhood placed limits on trading the stock. That angered investors trading on Robinhood due to the fact that a sufficient amount of shares in GME could not be bought that would allow for sufficient profit in the intraday price moves that the stock made. How can traders combat such moves made by stock trading company platforms?

The best way of combating limits placed on trading in specific stocks is to find another stock to trade. Too simplistic? Not hardly. There are thousands of stocks that trade on the U.S. stock exchanges everyday. Many stock traders and investor focus on the price movement of the 30 stocks in DOW. But the DOW Jones stocks are only representative of their respective sectors not of every stock in the sector. If the market (DJIA) is down for a given trading day there are many individual stocks, dozens at minimum, in the broader market that are up for the day.  The same is true for sectors that may be down, there can still be stocks within the sector that are up for the day. The key is to find one of these stocks and trade it.

When a stock receives unexpected interest from a lot of investors, whether retail or professional ones, the volume created in trading it can overwhelm a trading platform used to trade the stock's shares. Clearing all the trades (which is a different subject for a different article) can be problematic for a trading company since the amount of floating shares for the volatile stock may be limited. This may cause a problem for a trading company with limited shares to obtain shares for all investors who wish to purchase them.

Stock traders and investors want to be able to readily buy and sell stocks that are making big price moves so that a profit can be captured quickly. If everyone is limiting their attention to trading the same stock then share availability may be impacted and limitations by trading companies will result.

Since the US stock markets are the most liquid in the world there are always opportunities to be made outside of the viral stocks being traded. Profitable intraday trading happened for more stocks than GameStop when it was red hot. The way to combat the limitations were placed on GameStop, and other stocks, with limitations,  is to find highly traded and profitable stocks that don't have limitations placed on them. There are respectable stock research sites (like this one) that can help you identify stocks with high interest (measured in volume) along with volatility (measured in price movement). Trading in diversified profitable stocks that don't have limitations (yet) allow for quick profits  to be made smoothly.  Happy trading!

Determine Where You Will Invest, Is It Easy Or Hard?

What To Invest In

There are several different types of investments, stock market,  real estate, artwork, and there are many factors in determining where you should invest your funds.

Determining where you will invest begins with researching such things as, the various available types of investments, determining your risk tolerance, and determining your investment style – and your financial goals. The most liquid and diverse place to invest in is the stock market.

Stock Research Importance

If you were purchasing a new car, you would do quite a bit of research before making a final decision on your purchase. You would never purchase a car that you hadn't fully investigated and taken for a test drive. Similarly, investing in stocks works much the same way.

Learning about the stock market and the individual stocks in it takes a lot of time… time well spent of course. There are numerous books and websites on the topic, and you can even take college level courses on the topic – which is what stock brokers do.

Stock Research Shortcut

Does researching stocks have to be time consuming? With access to the Internet, you can actually research stocks, play the stock market with fake money to get a feel for how trading works and see if you can make money at it.

You can make pretend investments by searching for ‘Stock Market Games’ or ‘Stock Market Simulations.’ on any search engine. But how do you choose which stocks to "play with"?  You can fake trade but you can't fake research. Or can you?

No you can't use fake research to trade stocks, but you can take a shortcut. Let someone else do the research for you. That's how financial analysts and consultants make their money. But rather than interview or research analysts you probably would rather spend your time researching stocks you can buy.  A better shortcut is to use stock research already distilled into a list of the stocks that seem most promising based on the research already done by others.

Stock Watch Lists

Stock watch lists is what this website compiles for its members to refer to when they are buying and selling stocks. If you want to be an independent investor you will want to pull the trigger on your own trades and buy and sell according to your own preferences and tolerances for price movement.

Check out the watch lists in our member's area. Buy the stocks listed at the approximate time shown on the watch list and sell when the price rises to a point where you make the profit you desire, then sell the stock. For stock day traders this buying and selling can take place multiple times throughout the trading day, with the same stock or with different stocks. Financial planners don't recommend this type of investing because there is the danger of inexperienced traders losing money instead of making money.

If day trading stocks is too much risk for you then you should speak with a financial planner. Tell him or her your goals, and ask for their suggestions – this is after all what they do! A good financial planner can help you determine where to invest your funds, and help you set up a plan to reach all of your financial goals. Many will even teach you about investing along the way.

For just a dollar you can try using our watch lists produced daily for each hour of the trading day to pick stocks you want to trade. You'll have time to "paper trade" (fake trade) using one of the simulators you can find as mentioned previously in this article. Quite quickly, and cheaply, you can see whether day trading stocks using our watch lists will work for you.

Stock Trading For Beginners

How Do I Trade Stocks As A Beginner

Some may say if you are a beginner you shouldn't be trading stocks. But that sentiment ignores the fact that even current expert stock traders began as a beginner.  Whenever you decide to make your first trade you are by definition a beginner. But "beginner" doesn't have to equate to "dummy".

Obstacles For Beginner Stock Traders

It's easy to see how good or bad news about a company can make its stock price rise or fall.  Everyone will avoid the stock of a company with bad news. But it may take some time to learn about how volume, moving averages, moving average convergence and divergence, resistance levels, and support levels affect the  price of stocks. You can add to that the effect of interest rates, the economy, politics, and other factors to confuse things even more. So a beginner will have to take some time to become educated. An educated beginner can become successful fairly quickly as a stock trader, but that education need not take years.

Beginners Can Start With An Advantage

A well equipped beginner can also become successful quickly. Equipped how? With tips and a head start. Money is made as a stock trader by finding stocks that can be bought at  a low price and sold later at a higher price (buy low, sell high - no duh). Where are the stocks with a low price - relatively speaking - and relative to what? Well, winning stocks, the ones that can be bought low and sold higher later, are everywhere in the market, even on days where the market is down. Timing is what matters. Most successful stock traders subscribe to services that spotlight stocks ready to pivot and make a move. (The article you are reading now appears on such a service (this site)).

The Most Excellent Investor Advantage

Some stock traders prefer a service based on news or earnings fundamentals, others prefer technical trading indicators, many prefer both. This site spotlights stocks in watch lists based on a combination of technical indicators that signal that a stock is relatively low compared to the market in general, stocks in its sector, or to itself, and indicators signal the stock has enough interest from the market that it is ready to pivot up in price. Starting stock research with a watch list can give a trader a head start. The remaining activity is to check for news about a stock to make sure that there isn't any bad news that would make the relatively low price more expensive based on new risk.

To allow time to become familiar with using our stock watch lists all Most Excellent Investor membership levels begin with a seven day free trial period. During this trial period allows time for daily back testing and paper trading putting no money at risk.

With at least some education and the head start that our watch lists can give a beginner can mean less stress in becoming a successful trader.

Happy trading.

Why Should I Trade Stocks After The Market Closes?

What Is After Hours Trading?

When you talk to others about the stock market, you may find that some people are unaware of the vast potential there is to make money in it. The lack of knowledge regarding stock trading is because finding money making stocks can be very confusing, and time consuming. There are tricks that many learn at the beginning of their trading endeavor that always stick with them because they don’t have the time or inclination to learn more enhanced strategies or habits.  But add after hours trading to the discussion of making money in the stock market and the conversation becomes more complicated, but the results can be more profitable.

You might mistakenly think of after hours trading as putting your order in to buy or sell stock after the market has closed and before it opens the next day, and then your transaction would be completed as soon as the market opens. But that is not after hours trading, that would really be putting in a very late or a very early one since nothing takes place overnight.

After hours trading really means stock shares and money is actually exchanged after hours. This used to be something that was only open to corporations or private entities that would be buying or selling large blocks of stock, but after hours trading is now something that almost anyone can do. However, it should be done with a great deal of caution.

For one thing after hours you cannot do all of the things you can normally do during the traditional hours of the stock market.  For one thing the market is closed so there aren't as many players in it so trading volumes are lower which limits what takes place. You may only be able to enter a sell order to close a trading position, or only enter a buy order to open a new one. Round trips for the same stock usually isn't available. Also if you are trading overseas but just because the U.S. stock market is closed and you trade overseas that's not after market selling because those markets are just trading on their normal working hours.

Why Trade After Hours?

It's enticing to be able to take advantage of news that breaks after the market closes. Act soon enough and a buyer of stocks can benefit on a gap up in price at the market open by taking a position the night before if favorable overnight news about a particular stock brings tremendous interest in it. The next day. Reciprocally, it's advantageous to be able to get out of a stock after the market closes when bad news breaks. Using this strategy means paying close attention to market news all day every day.

If you really think that after hours trading is something that you should do, you do have to know what you can do and what you cannot. You should know exactly what you are doing and what to expect when you trade, and you may find that it is a bit more complicated and a bit more risky than you first thought. You should contact your broker about after hours trading to see what their policies are, and if it is something you can do or not. You may find that the best strategy for your particular portfolio is to keep on doing what you have been doing all along.

Can I Really Make Money Day Trading?

How To Trade Intraday For Profit

Buying at the right price and then selling at the right time is the way to make money day trading in the stock market.  Strange as it may sound money can be made intraday on a stock that loses money day to day, and the reverse is also true. Money can be lost intraday on a stock that makes money day to day.

Intraday Profitable Case Study - Fortress Biotech, Inc. (FBIO)

Proof for the statement above is seen in the 10-20-2020 trading chart for Fortress Biotech, Inc. (FBIO). A long stock position taken by buying FBIO at 9:34 a.m. at $2.58 could make a profit if sold intraday at 10:06 a.m. at $2.65. That trade would yield a gain of 2.7% in the span of only 32 minutes. There was over 69,000 shares of FBIO traded in the 32 minute timeframe mentioned above. Those 32 minutes was not the only intraday profitable timeframe for a position taken at 9:34 am, at 1:17 pm the price hit $2.65 again so there was a second chance intraday.

Further Money Making Intraday Opportunities

If profit was taken on the FBIO 9:34 am position even more money was available to be made by buying again at 10:44 am at $2.51. Another 4% gain could be made selling FBIO at 11:09 am at $2.63 which is a time span of only 25 minutes.

So by identifying and trading one stock intraday a greater profit can be made in minutes than a bank will pay on a savings deposited for a year.  So the answer to the question "Can I really make money day trading" is a definite YES!

Note: The FBIO 9:34 am entry entry point was identified on the MostExcellentInvestor.com 9:30 am - 10 am watchlist in the subscriber area.

What The Largest Stock By Dollar Volume Amazon (AMZN) Tells Trader’s About The Market

Does high dollar volume always mean rising price momentum? Of course not. Case in point is Amazon that actually has a price that has been trending down.  Check out the Friday 10-16-2020 1 day chart below:

Amazon (AMZN) 1 Day Price Chart
From Yahoo Finance

Subtly this stock is trending down if you look at its 5 day average.  Other high dollar volume stocks that are trending up instead of down are Apple (AAPL), Microsoft (MSFT), and Nvidia (NVDA). The trend up or down for these high dollar volume stocks can be long  and slow to build. Patience is needed, and they are worth investing in (holding for a long time) and are not good for trading (selling quickly).

On the other hand stocks that are good for trading are usually small cap stocks like JAKKS Pacific, Inc. (JAKK), and Ocean Power Technologies, Inc. (OPTT). Small caps like these two stocks can be traded for a good gain intraday. If the right entry point is entered then even if ultimately the stock drops in price by end of day a profitable exit point can be found.

Note: The entry entry point for JAKK and OPTT was identified on the MostExcellentInvestor.com 9:30 am - 10 am watchlist in the subscriber area.